Issued by: Joshua Politis, MBA
3rd of July 2020
“The energy industry that emerges from this crisis will be significantly different from the one that came before,” Fatih Birol, IEA’s executive director.
Executive Summary:
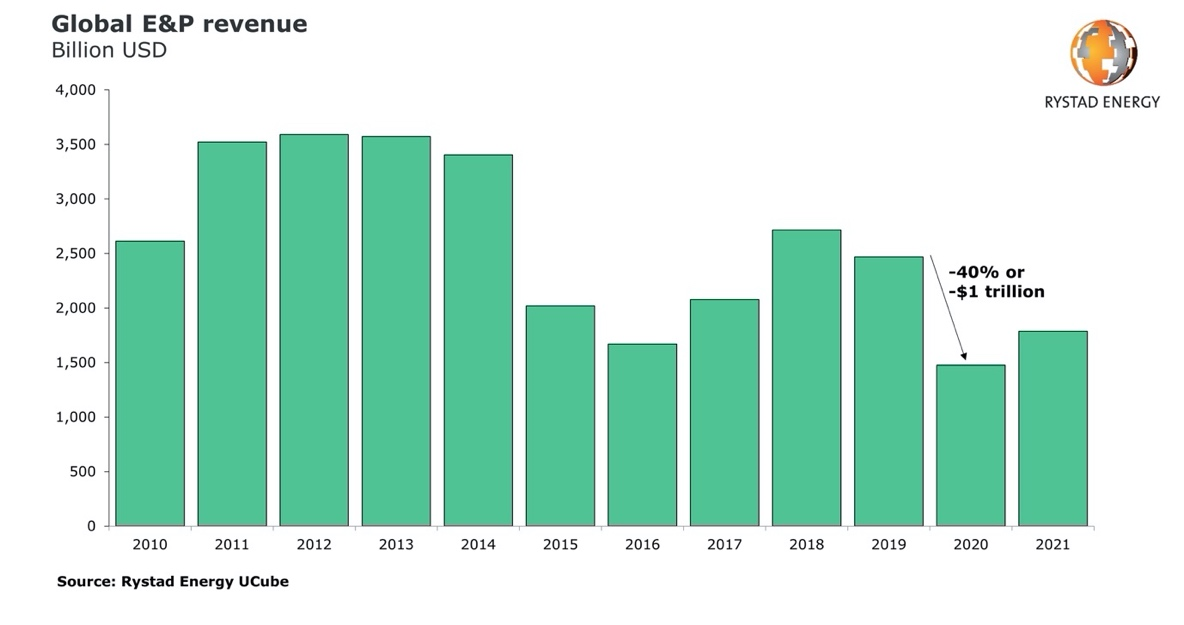
The International Energy Agency (IEA), an intergovernmental organization, estimates that upstream oil and gas investment this year is set to fall to its lowest level since 2005. Global Exploration & Production (E&P) spending is set to decrease by $156 billion (29%) in 2020. These CAPEX cuts will have a lasting impact on new field discoveries and FID (Final Investment Decision) sanctions. 2020 may well prove to be the lowest level of project sanctioning since the 1950s. Moreover, both the IEA and Rystad Energy, an energy consultancy firm, are forecasting over $1 trillion of declines in global E&P revenues in 2020, a 40% drop.
On the other hand, capital expenditures in the renewable energy sector this year is expected to total about $202 billion, up 6% from last year’s $190 billion, according to Wood Mackenzie, an energy consultancy firm.
The cost of photovoltaic power (PV) has declined by 82% since 2010. The International Renewable Energy Agency estimates that by 2021, a large-scale PV solar plant will be less expensive to run than a coal plant of up to 1200MW.
Looking past 2020 and to the mid and longer term, higher demand, continuously reducing costs, software and technological advancements as well as improvements in efficiency all point to a rapidly growing market.
Within the wind energy sector, offshore-wind has the highest growth potential and a compound annual growth rate of 15% is expected until 2030, when 175GW is expected to be operational. IHS Markit estimates a 600GW market worth $1.4 trillion by 2050.
Transport and heat represent 80% of total energy use and here hydrogen, in both its green and blue form, is growing as a potential clean substitute. The EU, and Germany in particular, has recently announced a very ambitious plan to make hydrogen an intrinsic part of the EU’s energy system by 2030 and quickly ramp up production capacity and infrastructure.
In 2021, renewable power is set to take the number one spot in global energy spend, surpassing upstream oil & gas for the first time ever amid a “seismic” shift in capital that could underpin $16 trillion of investments by 2030, according to Goldman Sachs. The bank sees a $1 – 2 trillion per annum investment opportunity in renewables, biofuels, power networks and hydrogen which is being driven by lower cost of financing and supportive government regulations.
Impact of Covid-19 on the energy markets – Accelerate energy transition, deep cuts to O&G CAPEX
Oil and Gas
Covid-19 and the price war between Saudi Arabia and Russia has led to the third major oil price crash in the last 12 years. This current collapse is a little different than the first two as it combines a supply shock with an unprecedented demand drop on the back of a global health pandemic. The oil and gas sector’s financial and structural health is also still reeling from the 2014 crash. Adding to this the governmental and societal pressure to lower carbon emissions, and some likely lasting behavioral changes from the Covid-19 pandemic, it seems less likely that the industry can simply rebound as it did in the past and continue with business as usual.
To echo recent comments by the CEOs of supermajors BP and Shell, we just don’t know what the future will look like. Have we hit Peak Oil? Peak demand? Possibly, all we know today is that the future is very uncertain.
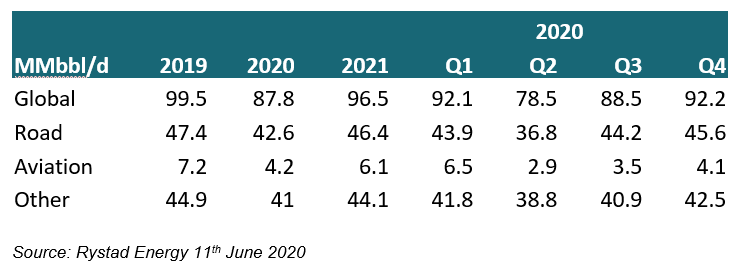
At its peak in April, oil demand was down 25 million bpd. For the entire year, oil demand could drop by an average of close to 9 million bpd, returning consumption to 2012 levels.
Gas demand is expected to fall by 150 Bcm (billion cubic meters) for 2020, a 4% decrease from 2019 levels and the largest on record. This would be double the 2% drop seen after the 2009 downturn.
In early April, OPEC+ together with major G20 producers agreed to circa 14 million per day production cuts for May and June. OPEC+ has now extended their historic cut of 9.7m bpd to end July 2020, after which the cuts will start to taper off as planned until April 2022. Global oil output is currently expected to fall by circa 6% in full year 2020.
In the IEA’s latest energy investment report in late May, it expected global investment in energy to fall by 20% (circa $400 billion) while global investment in Oil and Gas would fall by one third in 2020, with US Shale leading the way with a 50% decline. Global energy revenues were set to fall by over $1 trillion in 2020, with oil accounting for most of this decline.
In most plausible scenarios, the decline in producing oil fields exceeds the decline in the demand curve. According to the IEA, if investment stays at 2020 levels, the expected level of oil supply in 2025 would reduce by close to 9 million barrels per day. Thus, even with Peak oil demand behind us or in the near future, followed by a gradual decrease in consumption as cleaner substitutes take its place, more wells will need to be drilled and new fields will need to be developed just to keep supply in balance. And if oil demand returns to 2019 levels in the next 18 – 24 months as the world economies recover, the risk of a tight oil market due to undersupply is clear.
With regards to gas, low prices have increased coal to gas switching for power generation in certain markets. If prices stay low, this is expected to continue to increase. However, the IEA is also predicting lasting impact on future market developments and estimates that the 2020 crisis will result in 75 Bcm of lost annual demand by 2025. Most future growth is expected to come from the industrial sector in Asia, and this is heavily reliant on the domestic and export markets for industrial goods.
In the coming decade, gas and LNG will likely play an important role in the energy transition, given it is cleaner for power generation than coal. LNG also has a place as a transition fuel between oil and renewables on the road to carbon free transport, as does blue hydrogen (extracted from natural gas and using carbon capture technology). However, in the longer term, gas will face similar pressures as oil with peak demand expected sometime in the 2030s.
In terms of renewables for oil and gas majors, while their commitments to spend as part of their energy transition plans are expected to be maintained this year, they are still too minor to have any real impact. Investments by the oil and gas sector account for less than 2% of global solar and wind capacity. However, at lower oil prices, the returns on new oil and gas projects can be quite similar to the average returns from low risk solar and wind projects (typically 5 – 10% IRR). And this is also before taking into account the widening cost of capital for carbon projects, which Goldman Sachs in a recent report puts as high as 20% for long term oil versus 3 – 5% for renewables.
With increasing pressures from governments and society at large, low carbon investments by oil majors will likely grow going forward.
Looking at potential carbon free transport fuels of the future, hydrogen is still at the early stages but looking more and more promising. While hydrogen gas produced from renewable energy (green hydrogen) is the ultimate goal, in the foreseeable future the sector can only realistically scale up to large volumes and infrastructure with carbon free hydrogen produced from gas (blue hydrogen) while using carbon capture systems (CCS). For this, oil and gas companies will have a role to play both in supplying the gas and in developing the CCS systems.
Even before the pandemic however, oil demand growth was increasingly concentrated in plastics, rather than fuels. The search for alternatives in this area is still at an earlier stage and thus it is more difficult to envision a noted decrease in this source of demand in the short to mid-term.
Renewables:
The role of governments and regulators will be crucial in shaping the post Covid-19 world and there is increasing hope for a climate-focused post-Covid-19 economic recovery. This seems the most likely in the EU which is expected to declare a net zero emissions by 2050 strategy. In late May, the European Commission unveiled a €750 billion economic recovery package, with a focus on “rolling out renewable energy projects, especially wind and solar, and kick-starting a clean hydrogen economy in Europe.”
For 2020 as a whole, output from renewable energy sources is expected to increase because of low operating costs and preferential access to many power systems. Global CO2 emissions this year are expected to decline by 8%, or almost 2.6 gigatonnes, to around 2010 levels. The prior largest decline ever was 0.4 gigatonnes in the 2009 Global Financial Crisis.
Renewables now represent 24% of total global power generation versus 20% in 2010. Wind and Solar have been growing fast while Hydro has seen slower growth. However renewable energy as a percentage of total energy consumed remains at 10% as energy use in transport and heat (including industrials) represent 80% of total energy use and has been growing.
BloombergNEF estimates that if current trends continue, wind and solar will produce half the world’s electricity by 2050 with nuclear, hydro and other renewable sources providing a further 21%.
Renewables accounted for nearly three-quarters of global power capacity additions last year, according to the International Renewable Energy Agency, which calculated that $110 trillion must be invested globally by 2050 to meet targets for reducing carbon emissions in line with the Paris Agreement on climate change.
In addition to power generation, low carbon solutions are required for transport fuels and plastics. While renewable energy is increasingly being used to generate electricity for electrical vehicles, zero carbon fuels and plastics are still in much earlier stages of technological development.
Oil supply, demand and price forecasts
Supply
Following the OPEC+ agreement to cut oil production reached in early April, global oil supply in May will reduce by an unprecedented 11.8 million bpd. This decline includes economic shut ins in the US, Canada and other non-OPEC producing countries which have risen to 4.5 million bpd since the start of the year. The OPEC+ 9.6 million bpd cut (circa 10% of world supply) have just been extended to then end of July, after which they will gradually taper off until 2021. For June, Saudi Arabia, Kuwait and Abu Dhabi committed to further cuts of 1.2m bpd but these will not continue in July.
The IEA’s forecast in their latest June oil market report is for global oil supply to be 7.2 million bpd lower in 2020, followed by a 1.7 million bpd increase in 2021 (assuming 100% compliance with OPEC+ cuts). US production, which is estimated to fall to 10.5 million bpd in June (a 2.4 million bpd decline from the record high), is set to fall by 0.9 million bpd for 2020 and a further 0.3 million bpd for 2021.
Excess production has led to global stocks rising and as per the latest data are estimated to be about 200 million barrels above their 5 year averages. Floating storage was slightly lower at 166 million barrels in May. And according to Rystad, the world’s available crude production capacity which could come back onstream in a matter of months, is approximately 13 million bpd.
Taking a longer-term view, the underinvestment over the last several years, compounded by the current crisis’ induced CAPEX cuts which are expected to continue for the next several years, will lead to significantly reduced supply in future years. The IEA estimates that based on 2020 investment levels, 2025 production will be 9 million bpd lower.
Demand
The latest IEA forecast shows demand for oil as set to fall by 8.1 million bpd in 2020, recovering by 5.7 million bpd in 2021 (which is still 2.4 million bpd below 2019 levels).
Overall demand for energy is set to fall by 6% in 2020, the largest decline in 70 years in percentage terms and the largest ever in absolute terms. This drop would also be seven times larger than what we saw during the 2008 financial crisis. Rich countries are expected to show steeper declines than the global averages with demand in the U.S. falling by 9% and the European Union by 11% over the full year.
On the other hand, Rystad is estimating a decrease in oil demand for 2020 of 11.8%, or 11.7m bpd. This is broken down to a decrease of 10% for road fuels, 41% for jet fuel and 9% for other fuels.
Global oil demand is unlikely to return to 2019 levels before 2022 – 2023.
On a longer time scale, the decarbonization of transport will have significant impacts on oil demand. BloombergNEF estimates that transport electrification has already removed 1 million bpd of oil demand. By 2040, they estimate it will remove 17.6 million bpd. While aviation and shipping are further away on their decarbonization journeys, developments in hydrogen fuel technology as well as LNG infrastructure should start to chip away at oil demand over the coming years and decades.
Price Forecasts
Oil
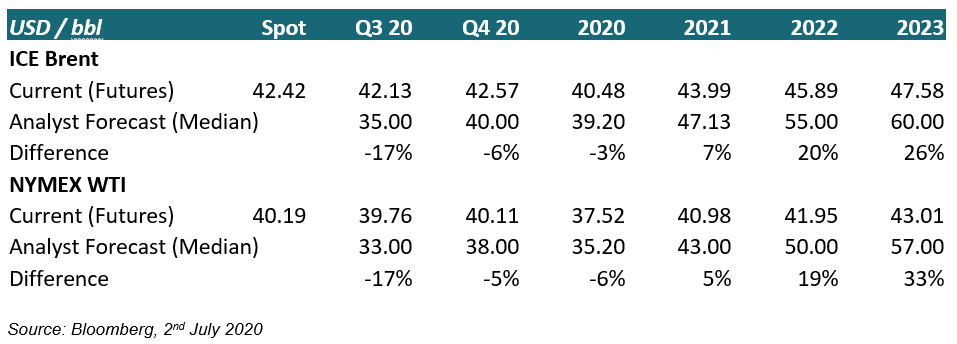
Looking at best case scenarios, oil is seen to recover to 2019 levels of $50 – 60 per barrel in 2021 or 2022. If demand quickly returns to pre Covid-19 levels, then a temporary price spike is possible given the current massive declines in investments in new fields will lead to lower supplies in futures. Other scenarios only model a return to 2019 price levels in 2024 or even never reaching back to those heights again. In any case, it looks like oil is set for some challenging times in the coming years.
Gas
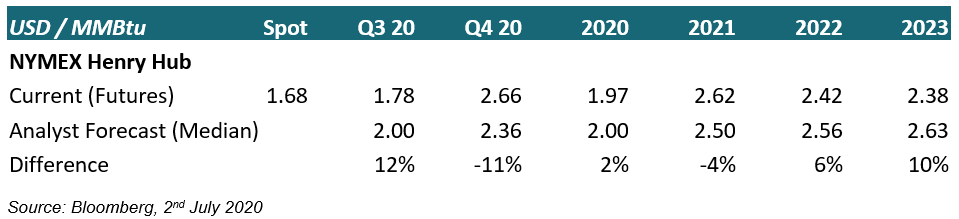
In a recent report, McKinsey posits that regional gas prices can fall much lower than in previous downturns due to the combination of the lower demand from Covid-19 and the abundant supply from US shale gas at breakeven costs of less than $2.5 to $3.0 per MMBtu. North America is set to become one of the largest LNG exporters and so prices in Asia will be driven by Henry Hub plus cost for transportation and liquefaction ($1 – $2 per MMBtu).
European and Asian gas prices, forecasted to average $3.3 per MMBTu and $3.8 per MMBtu in 2020 respectively, are below the coal to gas switching price in most countries.
Implications for a selection of energy market segments
Both the IEA and Rystad Energy are forecasting over $1 Trillion of declines in global E&P revenues in 2020, a 40% drop. This massive shortfall will have far reaching consequences throughout the whole energy ecosystem.
 Source: Rystad Energy
Integrated Oil Majors
The main group consists of US majors ExxonMobil and Chevron and European majors Shell, BP, Total, ENI and Equinor.
Wood Mackenzie, another respected research firm in the energy space, estimates cash flow breakeven for the Majors to have fallen from $63 per bbl in 2015 to an average of $40 per bbl at the start of 2020. Deep spending cuts will be required to achieve cash flow neutrality at $35 per bbl in 2020 and these will consist mainly of CAPEX and shareholder distribution cuts.
Breakeven Oil Prices & Dividends
All majors have so far stopped share buybacks and cut spending plans but only Shell and Equinor have till now announced dividend cuts. Equinor was the first to cut in April (67% reduction) and announced that following all the measures it has taken, it was now able to breakeven at $25 per bbl pre dividend (about $30 per bbl post).
Following Shell’s historic 66% dividend cut, the first since World War 2, Wood Mackenzie estimated the cut reduced Shell’s 2020 cash flow breakeven from $51 per bbl to $31 per bbl. They also argued that the dividend reset will help to fund the company’s energy transition by reinvesting the cash generated by oil and gas into clean projects.
BP, Chevron, ExxonMobil and Total are due to pay out US$41 billions of dividends in 2020.
In an early June report, JP Morgan estimated that Exxon’s breakeven price to cover the dividend would remain above $60 per bbl for the next several years which would entail over $40b of net debt additions by 2023. They estimate that cutting the dividend in half would bring the breakeven below $50 per bbl and result in no net debt additions by 2025 and cut the long-term leverage ratio by half.
In a report on Chevron, they estimate that the company should be able to support its dividend with a Brent price of around $45 – 50 per bbl.
In mid-June, BP forecasted a historically large impairment of up to $17.5 billion on its oil and gas assets in Q2, which reflect a 30% drop in the long-term oil price assumptions used (long term Brent of $55 per bbl). These write offs will increase the company’s gearing and makes a potential dividend cut more likely. The company has also announced plans to cut 15% of its workforce (Chevron announced 10 – 15% cuts).
Total’s cash breakeven is estimated at $54 per bbl and is currently on track to reach $48 per bbl by 2022.
CAPEX
The majors have already announced $23.4 billion in CAPEX cuts for 2020. These CAPEX cuts will have a lasting impact on new discoveries and FID sanctions. 2020 may well prove to be the lowest level of project sanctioning since the 1950s. The estimated full year level of $110 billion is just a quarter of the amount sanctioned in 2019. Most of the projects are being deferred rather than outright cancelled. However, it can take several years to restart a deferred project, especially as new breakeven price benchmarks are used.
In contrast to the 2014 downturn though, this time most service contractors are already in distressed financial positions and almost all the cost reductions have already been wrung out of the supply chain. Until oil prices recover meaningfully, companies will likely use extreme caution before committing investment to new projects. However, this also creates risks in the medium term as new production is not being brought on stream and a lot of existing production is mature. This can create issues with declining production levels.
Adding to this the focus of many operators of reaching carbon neutrality and focussing new investment on low carbon projects, this could mean “peak oil” coming a lot quicker than we were expecting at the start of 2020.
Energy Transition & Net-Zero goals
While this is till now still mainly a European phenomenon, and at a very early stage, it must be noted that all European majors have now committed to varying degrees to net-zero by 2050 goals and announced steps to restructure their businesses along these lines. All future spending plans will likely be judged against these energy transition goals, and this will have lasting and far reaching impacts on their oil and gas activities.
While 2020 oil and gas CAPEX has been slashed post crisis, spending commitments for low carbon projects have for the most part been maintained. As an example, Total has been increasingly moving into consumer power distribution and recently made its first significant move in offshore wind by buying 51% of a major wind project off Scotland. These commitments will only likely grow over the coming years and at some point, it should be expected that the US majors will join the bandwagon as well.
Oilfield Services
“ … Contracting is a volatile, changing business, with frequent and virtually unpredictable ups and downs—the good times being better than expected and the lows being worse than would seem justified.”
Alden (“Doc”) Laborde, the father of the semi-submersible rig. Mr. Laborde’s remarks had been made upon retiring in the late 1970s.
According to a Rystad analysis, Global Exploration and Production (E&P) spending is estimated to decrease from $539 billion in 2019 to $383 billion in 2020, a 29% decline and to the lowest absolute level in 15 years. 2021 is only expected to be marginally higher at $386 billion.
 Source: Rystad Energy
The massive drop in E&P CAPEX has a direct effect on the revenue generating capacity of the Oilfield services sector. Leading broker Clarksons Platou estimates offshore spending on oilfield services to fall to $132 billion in 2020 and $120 billion in 2021 (2019: $158 billion). In addition, much of the industry was in a dire position coming into the crisis given the legacy issues of very high debt, over supply of assets and the very weak charter rates of the past 5 years. Even though many companies have gone into bankruptcy or other forms of restructuring since 2014, there has not been enough debt equitization and consolidation to engender the required capacity reductions and capability upgrades needed. This new crisis may well push for the radical changes needed to bring the industry back to health.
Offshore wind, including deeper floating wind, is a bright spot for a few of the service companies that have traditionally focused on offshore oil and gas work and in the longer term, the increase of decommissioning work for older fields will also bring some new work.
EPCI (Engineering, Procurement, Construction and Installation)
Market leaders: Subsea 7, Technip, Saipem, McDermott
This sector has been relatively less negatively impacted so far by the crisis than others mainly because the companies typically have longer contract cycles and stronger backlogs of existing projects. They have also diversified somewhat out of oil and gas work and moved to offshore construction projects for offshore wind farms.
However, Westwood Global Energy expects EPC contract awards to total only $30 billion for 2020. This is less than half the $68 billion they had been forecasting at the start of 2020 and 37% less than the total awarded for 2019.
The dramatic fall in new FIDs will have a negative impact and will lead to a number of the operator’s assets being idle. Their focus will be on increasing opportunities in offshore wind and large cost cutting campaigns to survive the next few years. Longer term, an increase in field shut-ins could lead to decommissioning opportunities.
With regards to the potential decommissioning market, Rystad forecasts $42 billion of decommissioning work by 2024, with 80% of that in the UK North Sea. They see 20% growth in annual commitments till 2022. In the UK, almost 80% of the country’s oil and gas assets have produced more than 75% of their available resources.
More than 2500 oil and gas wells are expected to be decommissioned in the next 10 years with 60% of those in the UK. 45% of decommissioning costs come from the plugging and abandonment (P&A) of wells while a further 20% comes from the removal of platforms.
Offshore Drillers
Market leaders: Transocean, Valaris, Diamond, Seadrill, Noble.
On the corporate side, Diamond Offshore filed for Chapter 11 end April, Valaris skipped an interest payment on 1st June and is expected to file for Chapter 11 by the end of the month, Seadril announced in May a massive write down and the hiring of restructuring advisors and Noble has a bond maturity due in August, the pricing of which indicates a Chapter 11 filing is likely imminent.
Leading shipbrokers Clarksons estimate that as many as 134 drilling contracts have been cancelled or renegotiated since February. These follow from the postponement or cancelation of 45 offshore field developments with a value of around $170 billion. They estimate that only $39 billion of offshore projects will be sanctioned in 2020, compared to $165 billion in 2019.
According to Baker Hughes, the worldwide number of active offshore rigs in May was 210, which was a reduction of 37 rigs from April. Year on year this was a 20% decline.
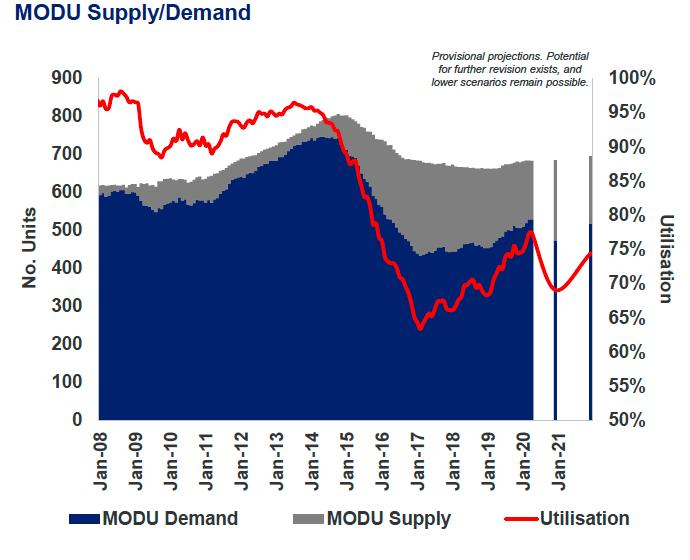 Source: Clarksons Research ODR May 2020
Clarksons estimates that utilisation of the combined Mobile Offshore Drilling Fleet could now fall by 8 percentage points to 66% (jack-ups 68%, floaters 61%) at the start of 2021, before potentially improving into 2022. The situation remains highly uncertain though and potential further downgrades remain possible.
$22 billion of contract value was cancelled between 2014 and 2017. The big difference with 2014 is that there are no legacy long term high day rate uncancellable contracts to tide the operators through. Most rigs working at the start of 2020 were on shorter term, low day rate contacts which had cancelation terms in favour of charters. It looks like going forward not only will utilisation levels fall significantly, but day rates will fall back to OPEX levels or slightly above.
The industry needs consolidation to wring out more costs and for most of the debt on the balance sheets to be wiped out. A large number of rigs (including many modern ones) will also need to be scrapped before supply and demand are back in balance.
Offshore Support Vessels (OSV)
Market leaders: Tidewater, Seacor Marine, Solstad, Siem, Swire Pacific
Similar to the offshore drillers, OSV owners are for the most part over levered and in need of financial restructuring. The supply demand imbalance in this sector is arguably worse than in any other due to the excessive newbuilding activity in the first half of the decade.
Clarkson’s estimates OSV demand to decline by a further 13% over the rest of 2020, as the effect of E&P spending cuts filters through fully. AHTS utilisation is expected to fall to 53% by end 2020 while PSV utilisation is expected to reach 56% at the end of the year. These are similar levels to the bottom of the post 2014 offshore downturn.
 Source: Clarksons Research OSV May 2020
The decline in rig activity has a direct effect on OSVs as they are used to service these drilling operations. On the production side, field shut ins will also reduce the need for support vessels. However, maintenance work for existing fields cannot be postponed indefinitely and this will eventually benefit some Subsea vessels.
OSV layups are expected to increase and similar to the drilling companies, mass consolidation and debt restructuring is required to bring the industry back to health. These larger consolidated operators will then need the discipline to scrap large amounts of laid up OSVs to bring the supply side back in balance, reduce overhead costs and stand to benefit from increasing pricing power due to their scale in certain regions or asset classes.
There is some additional work achievable from offshore wind, especially from deeper water floating wind projects. Decommissioning projects will also require support vessels.
Mobile Offshore Production Units (FPSO, FLNG etc)
Market leaders: SBM, MODEC, BW Offshore
Given the longer lead times for offshore projects, companies in this sector typically have stronger backlogs from past years contracting activities. Since 2017, 28 FPSOs have been awarded with Modec winning seven, followed by SBM and Yinson with three awards each.
However, while at the start of the year 20 new mobile offshore production unit awards were expected, this estimate has now been revised down to 13 and there is room for this number to fall further given the amount of FIDs being postponed. For 2021, the forecast has been revised down from 22 new contract awards to 17.
There is also pressure to redesign projects to reduce costs and some projects may simply not be viable with sub $50 bbl oil prices.
Renewables
According to a Wood Mackenzie analysis, spending in the renewable energy sector this year is expected to total about US$202 billion, up 6% from last year’s $190 billion. This is their breakdown of the sources of capital:
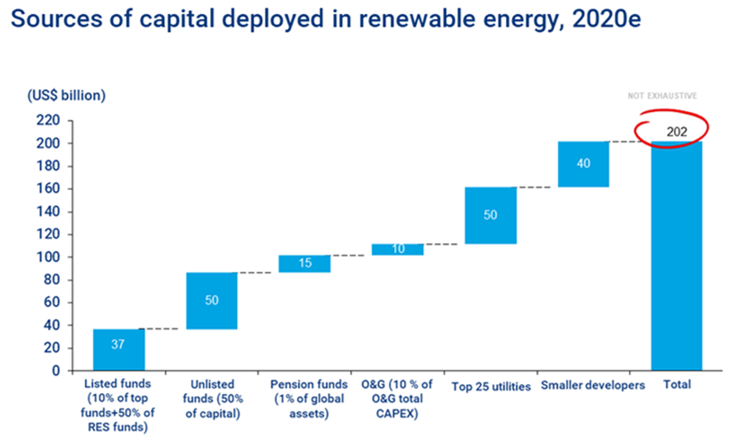 Source: WoodMackenzie, OECD, regulatory data, Institutional Investor Magazine
The oil and gas majors current planned investments in renewables over the next 5 years is minuscule at $17.5 billion (and almost exclusively made up of Equinor’s $10 billion commitment). This $17.5 billion for renewables compares to the $166 billion these companies are forecasted to spend on greenfield oil and gas projects. And Equinor is also the only major investing over 50% of its greenfield capital expenditure on renewable energy.
In the last 10 years, more than $2.7 trillion has been invested in developing renewable energy capacity. Renewables now account for 13.4% of the global power mix, more than doubling their share from 5.9% in 2009.
At the end of 2019, there was 651GW of installed solar capacity and 637GW of installed wind capacity.
In terms of investment figures for 2019, onshore and offshore wind came in first with $138.2 billion (up 6%) closely followed by solar at $131.1 billion (down 3%). The two combined added around 180 gigawatts of power.
China invested the most ($83.4 billion, down 8%) followed by the US ($55.5 billion, up 28%) and Europe ($54.3 billion, down 7%).
Solar
The top 10 manufacturers of solar PV modules are forecasted to account for more than 75% of production in 2020. Almost all are from China, and based on 2019 shipment numbers, JinkoSolar (14.2GW) is first, followed by JA Solar (10.3GW), Trina Solar (9.7GW), LONGI Solar (9GW) and Canadian Solar (8.5GW).
The cost of photovoltaic (PV) power has declined by 82% since 2010. The International Renewable Energy Agency estimates that by 2021, a large-scale PV solar plant will be less expensive to run than a coal plant of up to 1200GW.
By installed capacity, the Solar PV market grew by a record amount of 109GW or 14% in 2019. China accounted for 30GW, Europe 17GW and the United States 13 GW of new capacity.
There is currently significant manufacturing overcapacity in the market with global manufacturing capacity for cells of 150GW versus 120GW sold in 2019 (and only 109GW installed). Manufacturers, developers and traders have also built up inventories over the past few years. These high levels of inventories have however helped most developers mitigate the Covid-19 caused supply chain issues and thus limited delays. The major risks for solar projects are at installation though and due to the lockdowns in many countries, construction activity slowed and this will reduce the total amount of capacity installed in 2020. 2021 is expected to see a rebound effect to make up for these delays.
Looking past 2020 and to the mid and longer term, higher demand, continuously reducing costs, software and technological advancements as well as improvements in efficiency all point to a rapidly growing market. Chinese manufacturers are expected to continue to dominate production and while China, the US, Europe and India will remain the major markets, SE Asia, Latin America and the Middle East are expected to emerge as new growth markets.
Onshore Wind
Market leaders: Vestas, Goldwind, GE, Siemens Gamesa (these 4 manufacturers accounted for over half of the total commissioned capacity in 2019)
Global wind turbine commissioning increased 21% in 2019 to 61GW (88% of which was onshore). At the start of the year, Bloomberg NEF was expecting a 23% increase in 2020 to 75GW, comprised of 69.4GW onshore and 6GW offshore.
Total onshore additions in 2019 were 30.4GW in Asia Pacific, 13.3GW in the Americas, 9GW in Europe and 500MW in Africa and the Middle East. This strong growth was partly due to a rush by developers to build before subsidies expired in China and the US. However, this was counter balanced by issues in Germany due to shortages of available sites and litigation as well as in India where poor grid infrastructure and issues with land allocation delayed new installations.
The Covid-19 crisis is causing supply chain disruptions for developers and manufacturers which will cause short term delays in offshore wind deployment. However, the long-term prospects will be heavily tied to planned government targets and the economic recovery plans put in place.
Offshore wind:
Market leaders Siemens Gamesa (70% of global installed base), Vestas and GE
Offshore wind has high levels of potential and a 15% compound annual growth rate is expected to 2030, when 175GW is expected to be operational, which will come mainly from Europe and China (which will account for 80% of installed capacity by then). IHS Markit estimates a 600GW market worth $1.4 trillion by 2050.
In Europe, capital investment for offshore wind is expected to match oil and gas spend in 2021 and surpass it in 2022. $13.8 billion is expected to be spent in 2020, $18.2 billion in 2021 and $22 billion in 2022 (vs O&G CAPEX of $17 billion in 2022).
Bigger turbines lower the generation cost, and this will push the new farms into deeper water where floating technologies will be required. While onshore turbines have been achieving negative margins in the past few years, offshore turbines offer much higher margins.
The first semisubmersible floating wind farm is being completed offshore Portugal and Total has plans to build a 100MW floating wind farm off Wales.
Hydrogen and carbon capture, utilization, and storage (CCUS)
Hydrogen can be used as a substitute for coal, oil and gas in many varied applications. This is particularly true in highly fossil fuel dependent sectors of the economy such as heavy transport, steel and cement. Green hydrogen is made by splitting water into hydrogen and oxygen using renewable power (wind or solar). The cost of the electrolyser technology to do this has fallen by 40% in the past five years and can continue to decrease if hydrogen use scales up.
A number of larger hydrogen electrolyser projects have recently been announced. The most advanced is the Beijing Jingneng H2 facility which is due to start construction this year and operations in 2021. Shell recently announced a feasibility study for an offshore wind powered H2 production facility in the Netherlands. 3 of the top 5 largest planned hydrogen electrolyser projects are based in Australia.
Germany has now earmarked $10 billion to fund research and pilot projects for green hydrogen and aims to have 5GW of electrolyser capacity by 2030. This will also require significant further investments in offshore wind to power the electrolysers.
Carbon capture and storage (CCS) is a key component in producing blue hydrogen, using natural gas and reinjecting the carbon to make carbon neutral hydrogen. While green hydrogen, which is made via electrolysis exclusively from renewable power, is the ultimate zero emission goal, blue hydrogen is seen as necessary step to scale up hydrogen manufacturing capabilities and develop the required infrastructure over the next decade.
In May, Equinor, Shell and Total made a final investment decision on the Northern Lights CCS project. The companies have committed to spend $680m and the project will consist of capturing industrial CO2 and reinjecting it into the Osberg field offshore Norway.
Disclaimer/Imprint
This document is a customer information (“CI”) within the meaning of the Securities Trading Act (WpHG), the “CI” is directed exclusively to professional clients within the meaning of section 67 WpHG (natural and juristic persons) with habitual residence or registered office in Germany and is used solely for informational purposes.
Also, it was not written with the intention of providing legal or tax advice. The tax treatment of transactions depends on the personal circumstances of the respective customer and may be subject to future changes. The individual circumstances of the recipient (including the economic and financial situation) were not taken into account in the preparation of the “CI”.
An investment in mentioned financial instruments / investment strategy / financial service involves certain product specific risks – e.g. Market or industry risks and risk in currency,
default, liquidity, interest rate and credit – and is not suitable for all investors. Therefore, potential prospects should make an investment decision only after a detailed investment
advisory session by a registered investment advisor and after consulting all available sources of information. For further in-formation, please refer to the “Key Investor Information” and the securities prospectus on our website.
Past performance is not a reliable indicator of future performance. Recommendations and forecasts are non-binding value judgments about future events and may therefore prove to be inaccurate with respect to the future development of a product. The listed information refers exclusively to the time of the creation of this “CI”, a guarantee for timeliness and continued correctness cannot be accepted.
The above content reflects only the opinions of the author, a change of opinion is possible at any time, without it being published. The present “AI” is protected by copyright, any duplication and commercial use are not permitted. Date: July 3rd, 2020
Editor: Hubertus Clausius acts as a tied agent (section 2 (10) German Banking Act (KWG)) on behalf, in the name, for account and under the liability of the responsible legal entity BN & Partners Capital AG, Steinstrasse 33, 50374 Erftstadt. BN & Partners Capital AG has a corresponding license from the German Federal Financial Supervisory Authority (BaFin) for the provision of investment ad-vice in accordance with section 1 (1a) No. 1a KWG and the investment brokerage to section 1 (1a) No. 1 KWG.